
Their Stories, Our Stories
Rewriting the narrative on immigration and the U.S. economy.
Challenge: Public conversation about immigration is often shaped by misconceptions, "they take our jobs," "they don't pay taxes," "they don't contribute", repeated so often they get treated as fact. Data and research tell a different story, but statistics alone rarely change minds. The real challenge was finding a way to make that evidence land emotionally, not just informationally, so the piece needed to work on two levels at once: rigorous enough to hold up the facts, human enough to actually shift how someone feels about them.
My Approach: I built the piece around a single American city, Utica, NY, as a concrete lens for a national story. Utica lost nearly half its population after industrial decline, then was revitalized through decades of refugee resettlement starting in the 1970s. Structuring the narrative around one place let the piece move naturally from a vivid "imagine this" opening, through historical and economic data, into a myth-versus-reality breakdown addressing the most common misconceptions directly, before closing with real families whose stories embody exactly what the data shows. Each section was designed to build on the last: place the reader in a specific moment, ground it in real numbers, then let personal narrative do what statistics alone can't.
Solution: An interactive, scroll-driven story combining historical timeline data, sourced economic research, and profiles of real families, published as a fully designed digital narrative experience. The piece reframes a heavily politicized topic through evidence and story rather than argument, giving a reader a concrete, memorable answer the next time they hear one of the misconceptions it addresses.
A story told with many parts
Each section below uses a different visual technique to tell a piece of the story, chosen to show range in how content can be structured, not just written.
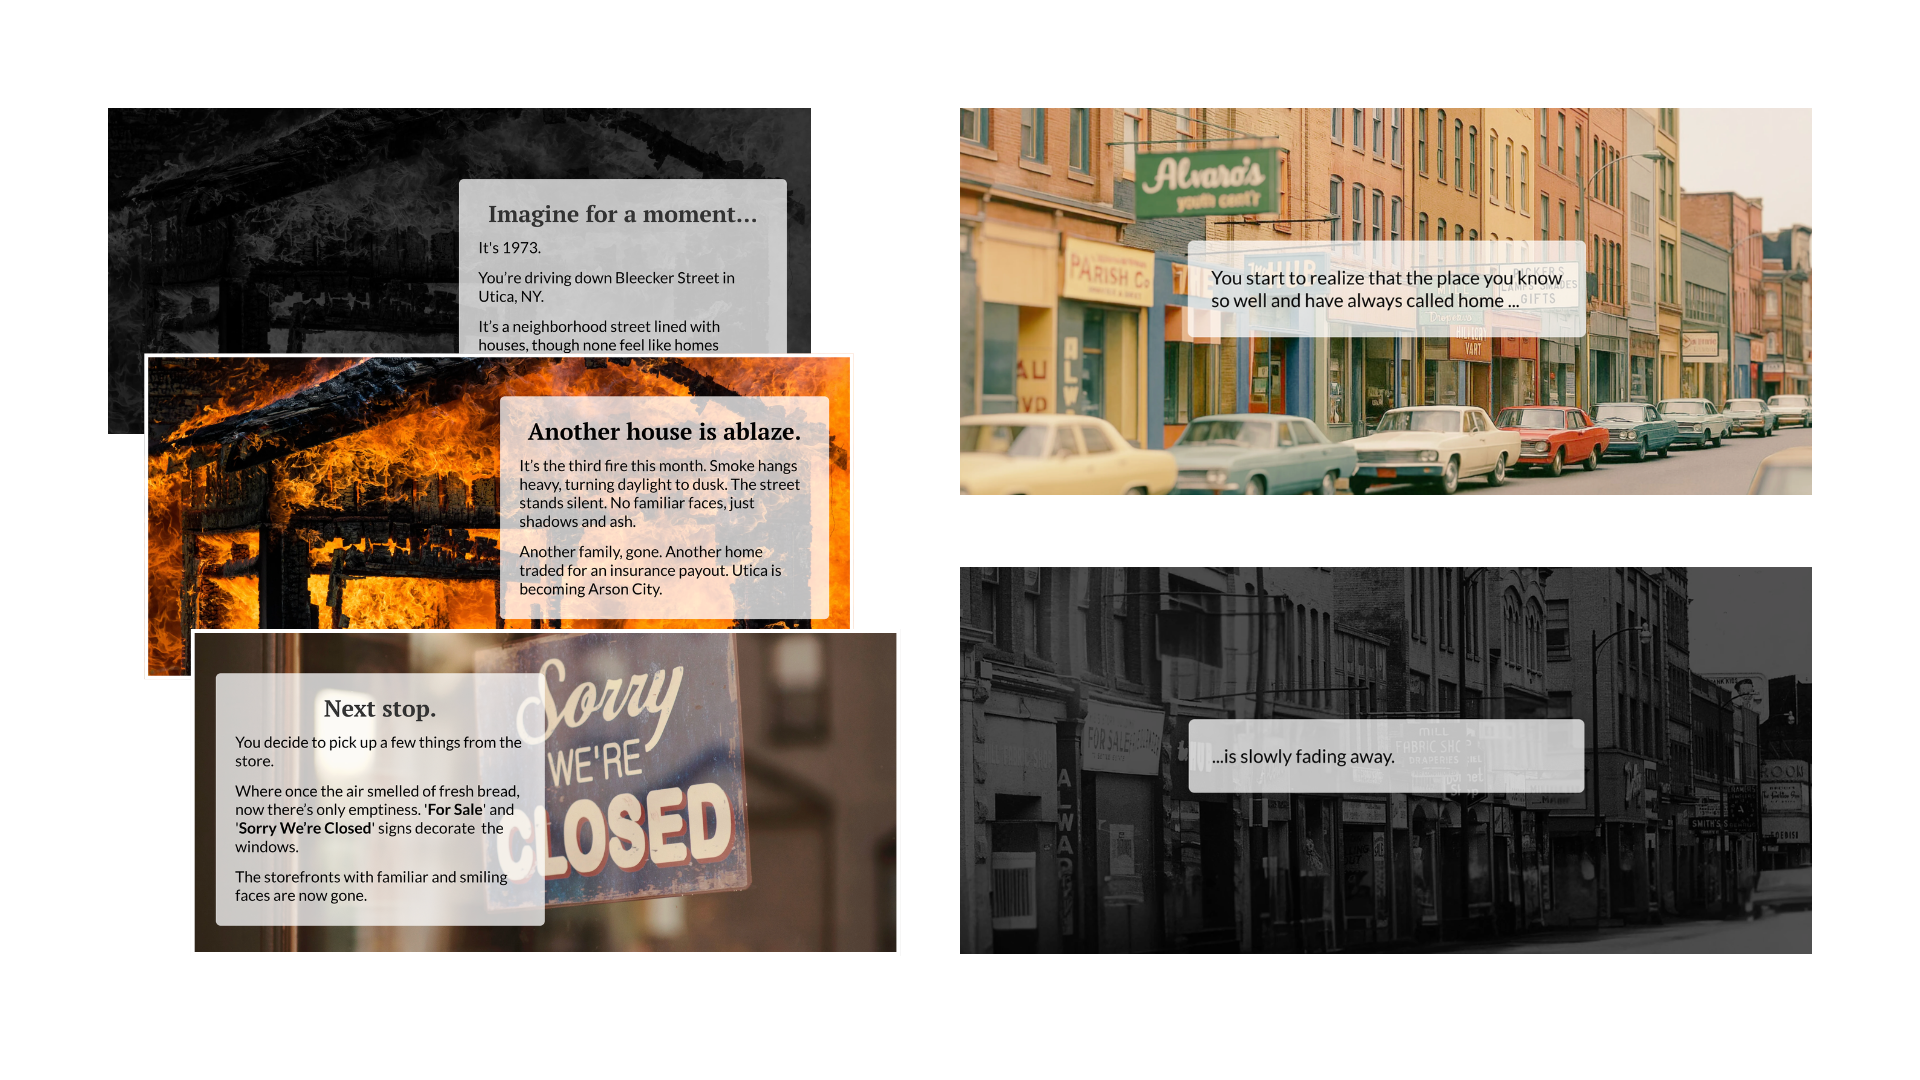
Setting the Scene
Layered photography walks the reader down one street in 1973, the color quietly draining away as the narrative shifts to decline.
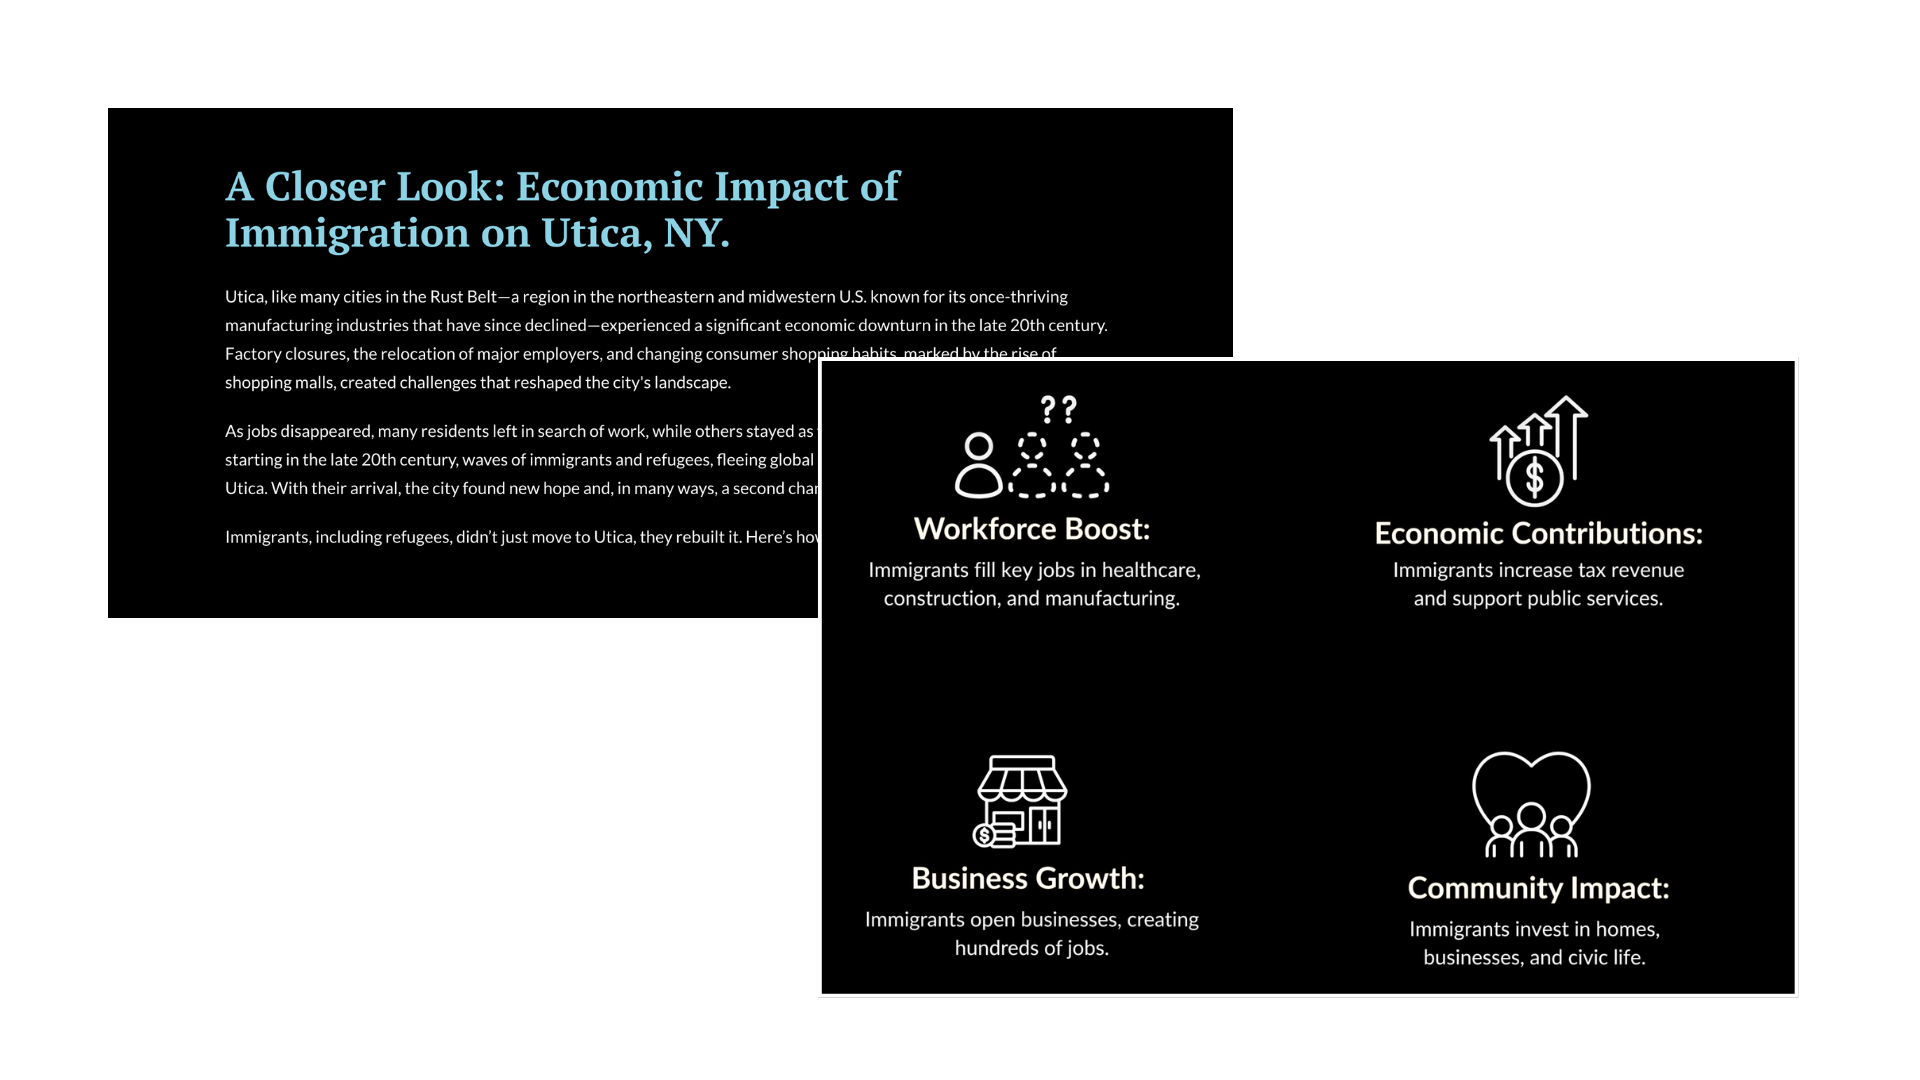
Distilling the Argument
After pages of context, the argument collapses into four scannable icons, a deliberate pause built into the pacing.
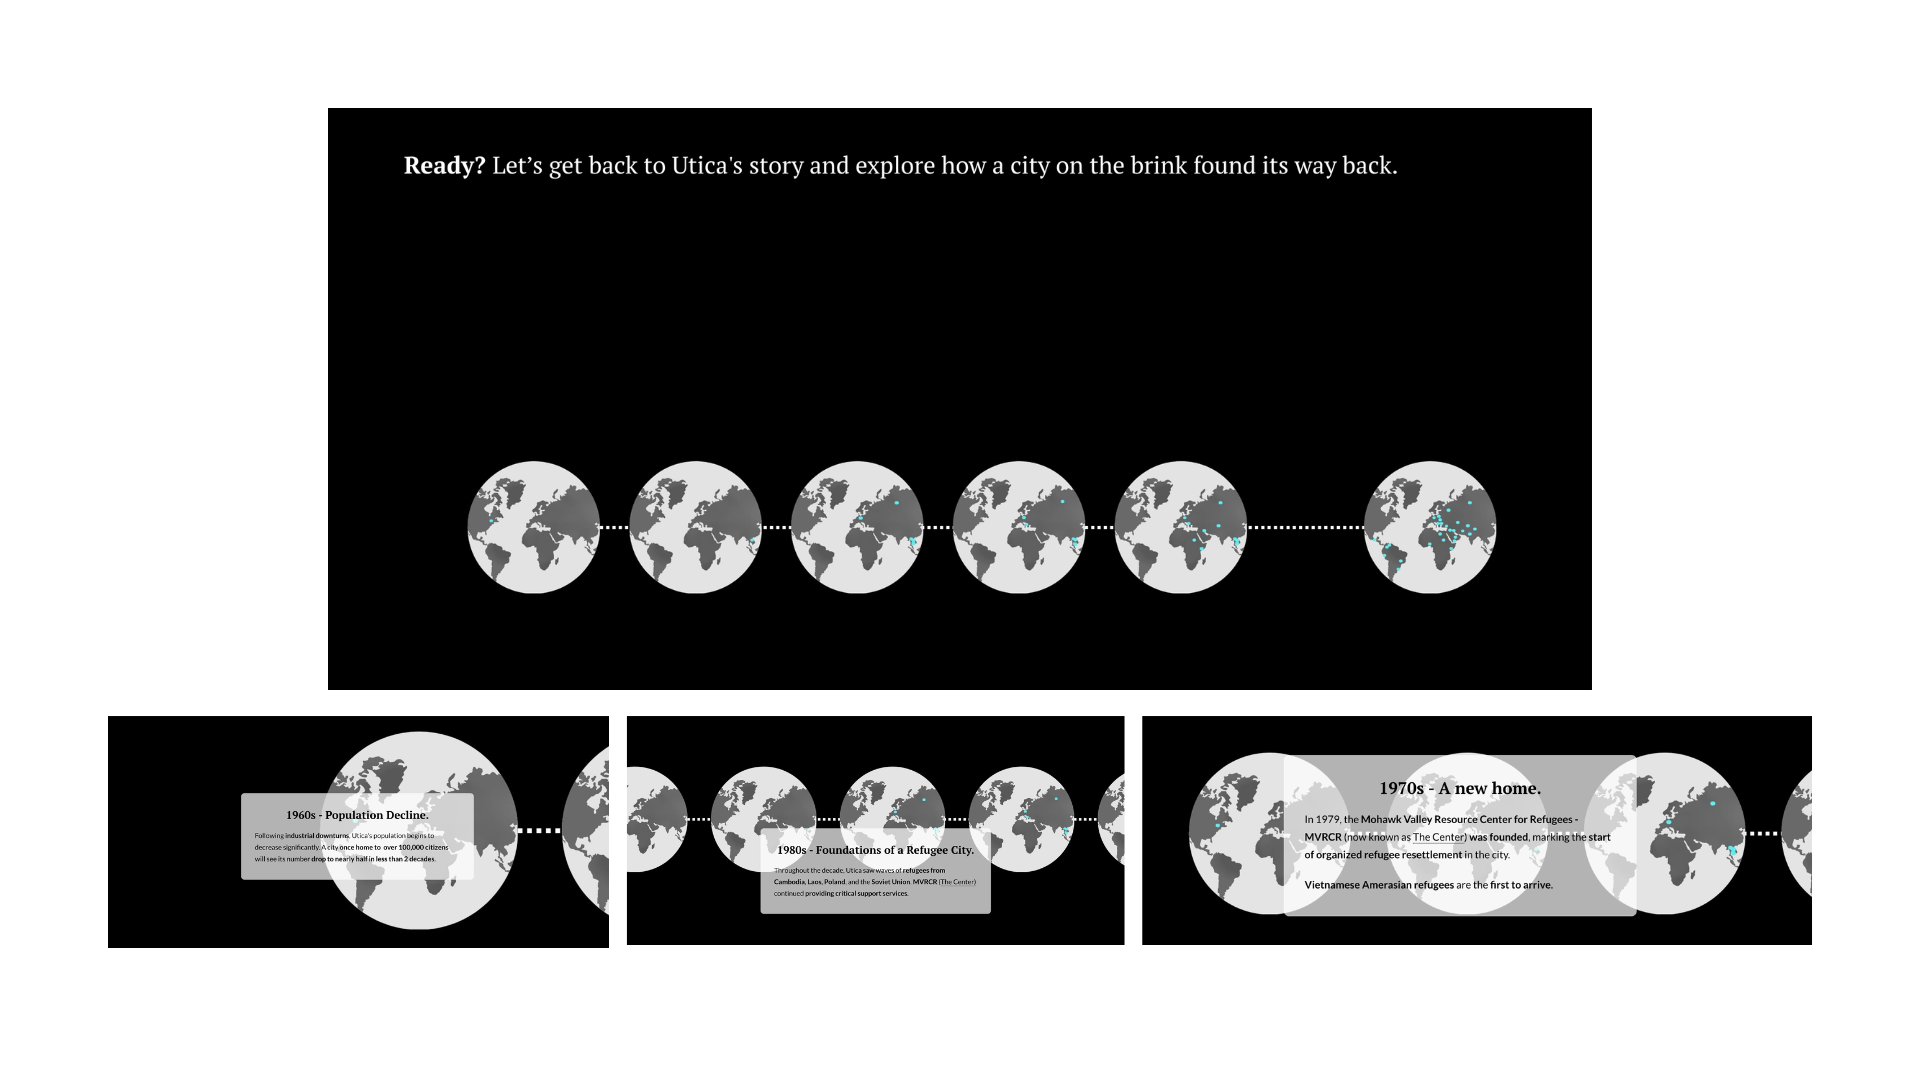
A Living Timeline
Decades of history unfold along a scrolling line of globes, each stop reinforcing that this is a global story arriving one city at a time.
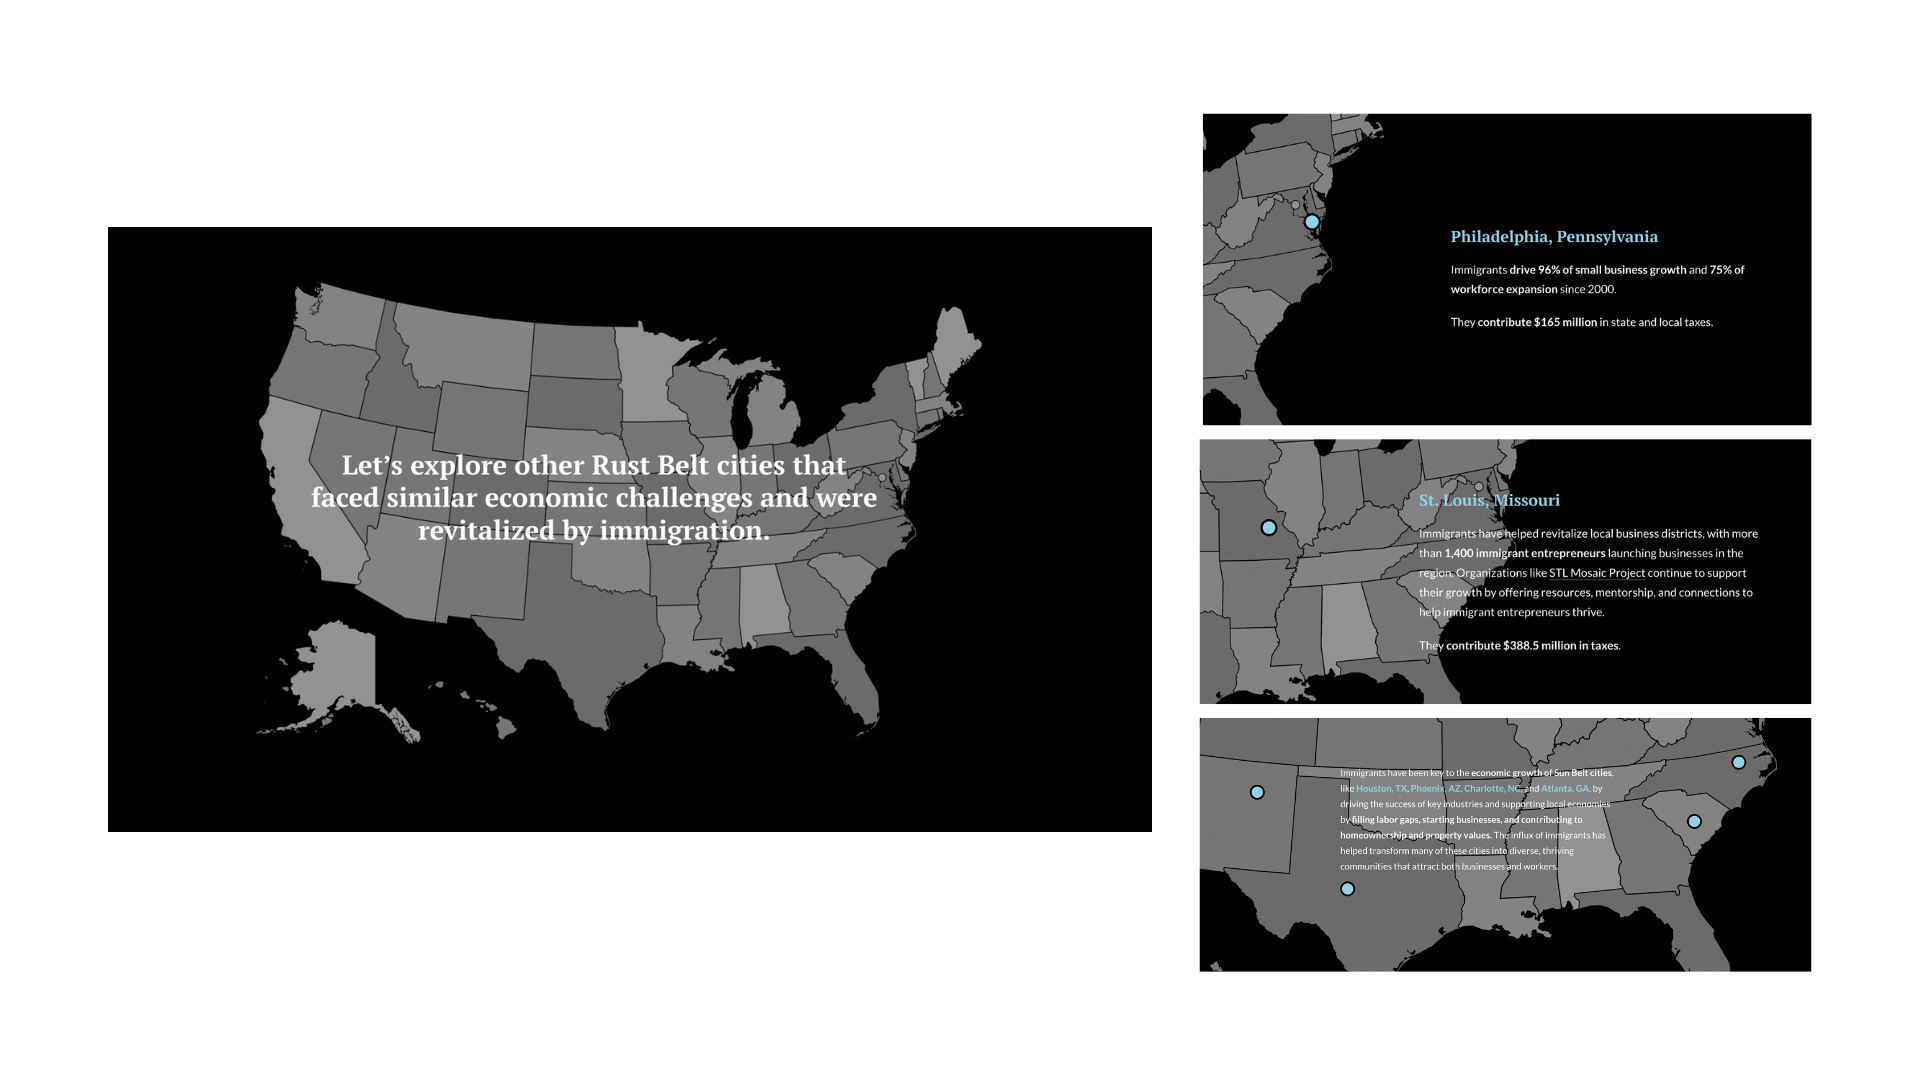
Mapping the Pattern
An interactive map zooms into city after city as the reader scrolls, turning "this happened elsewhere too" into something they can trace.
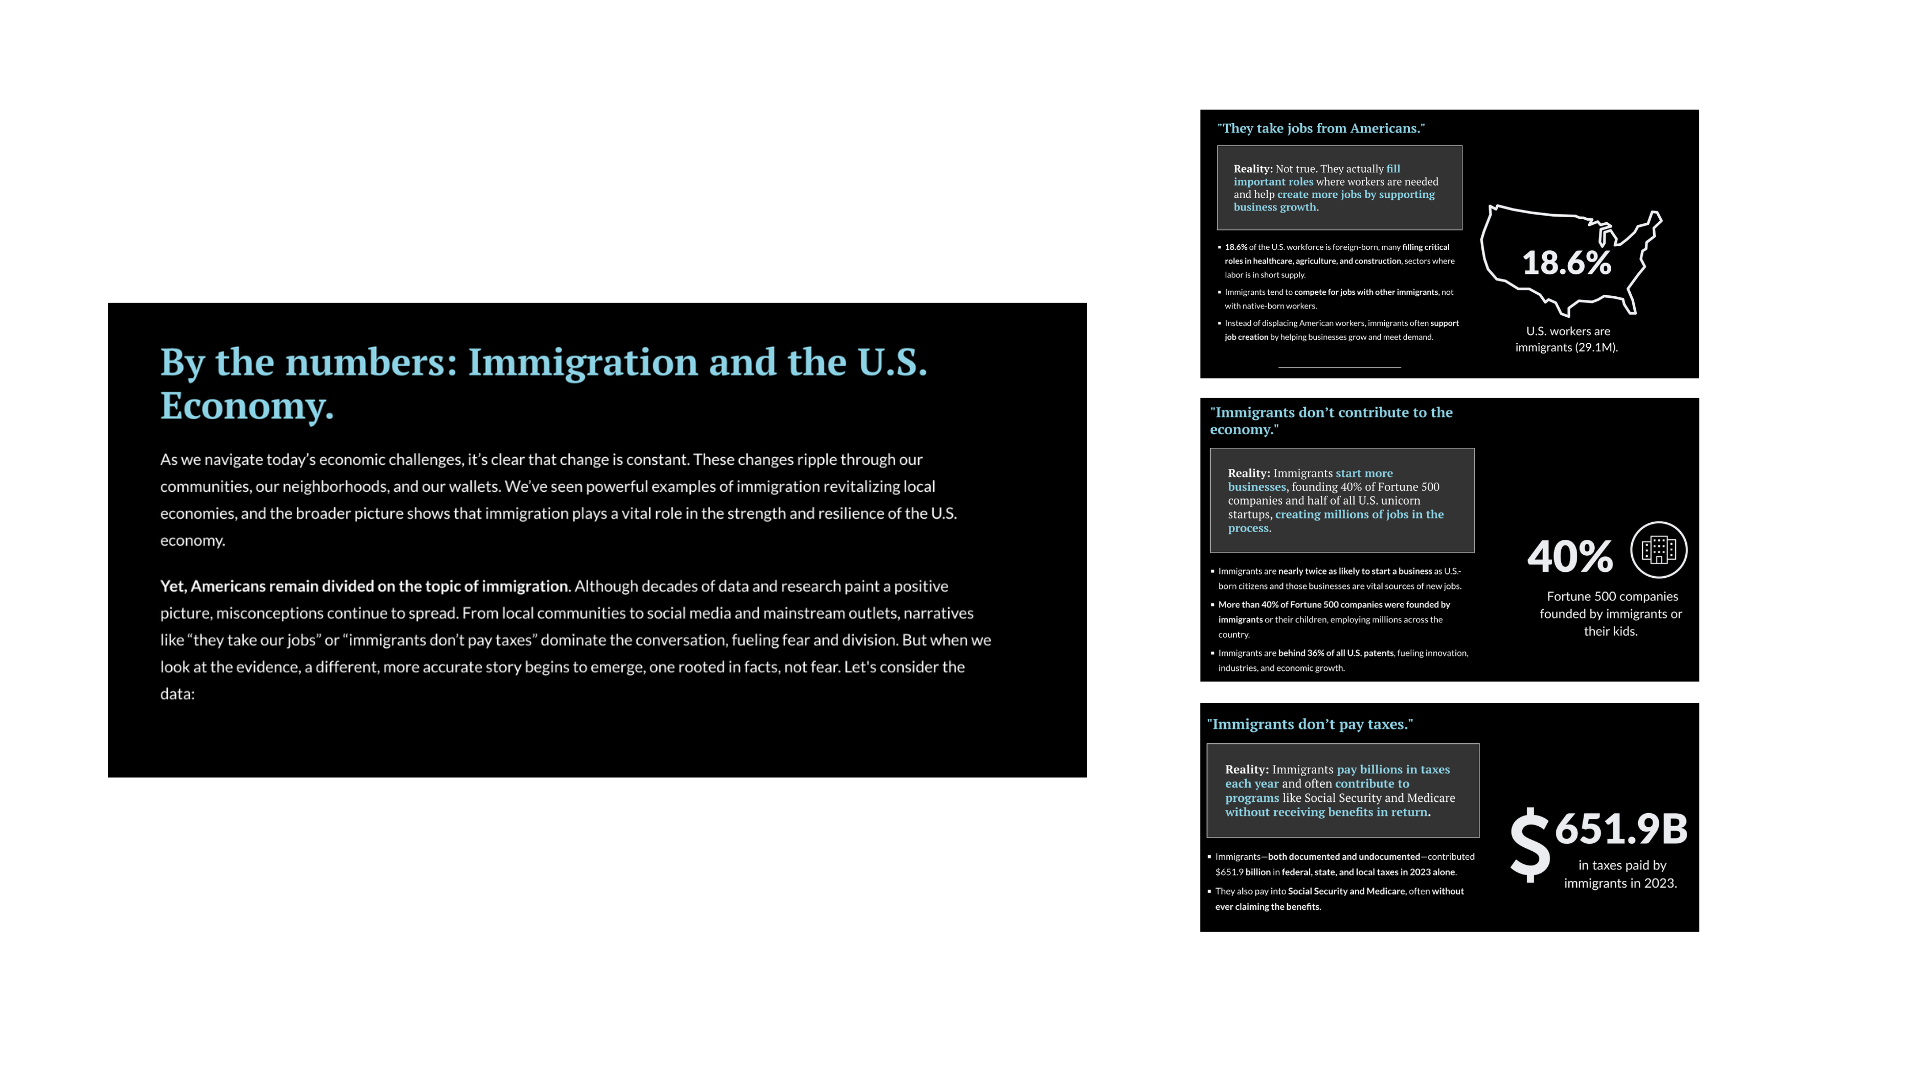
Myth vs. Reality
Each misconception gets its own card: the myth in quotes, the reality beside it, backed by one striking number.
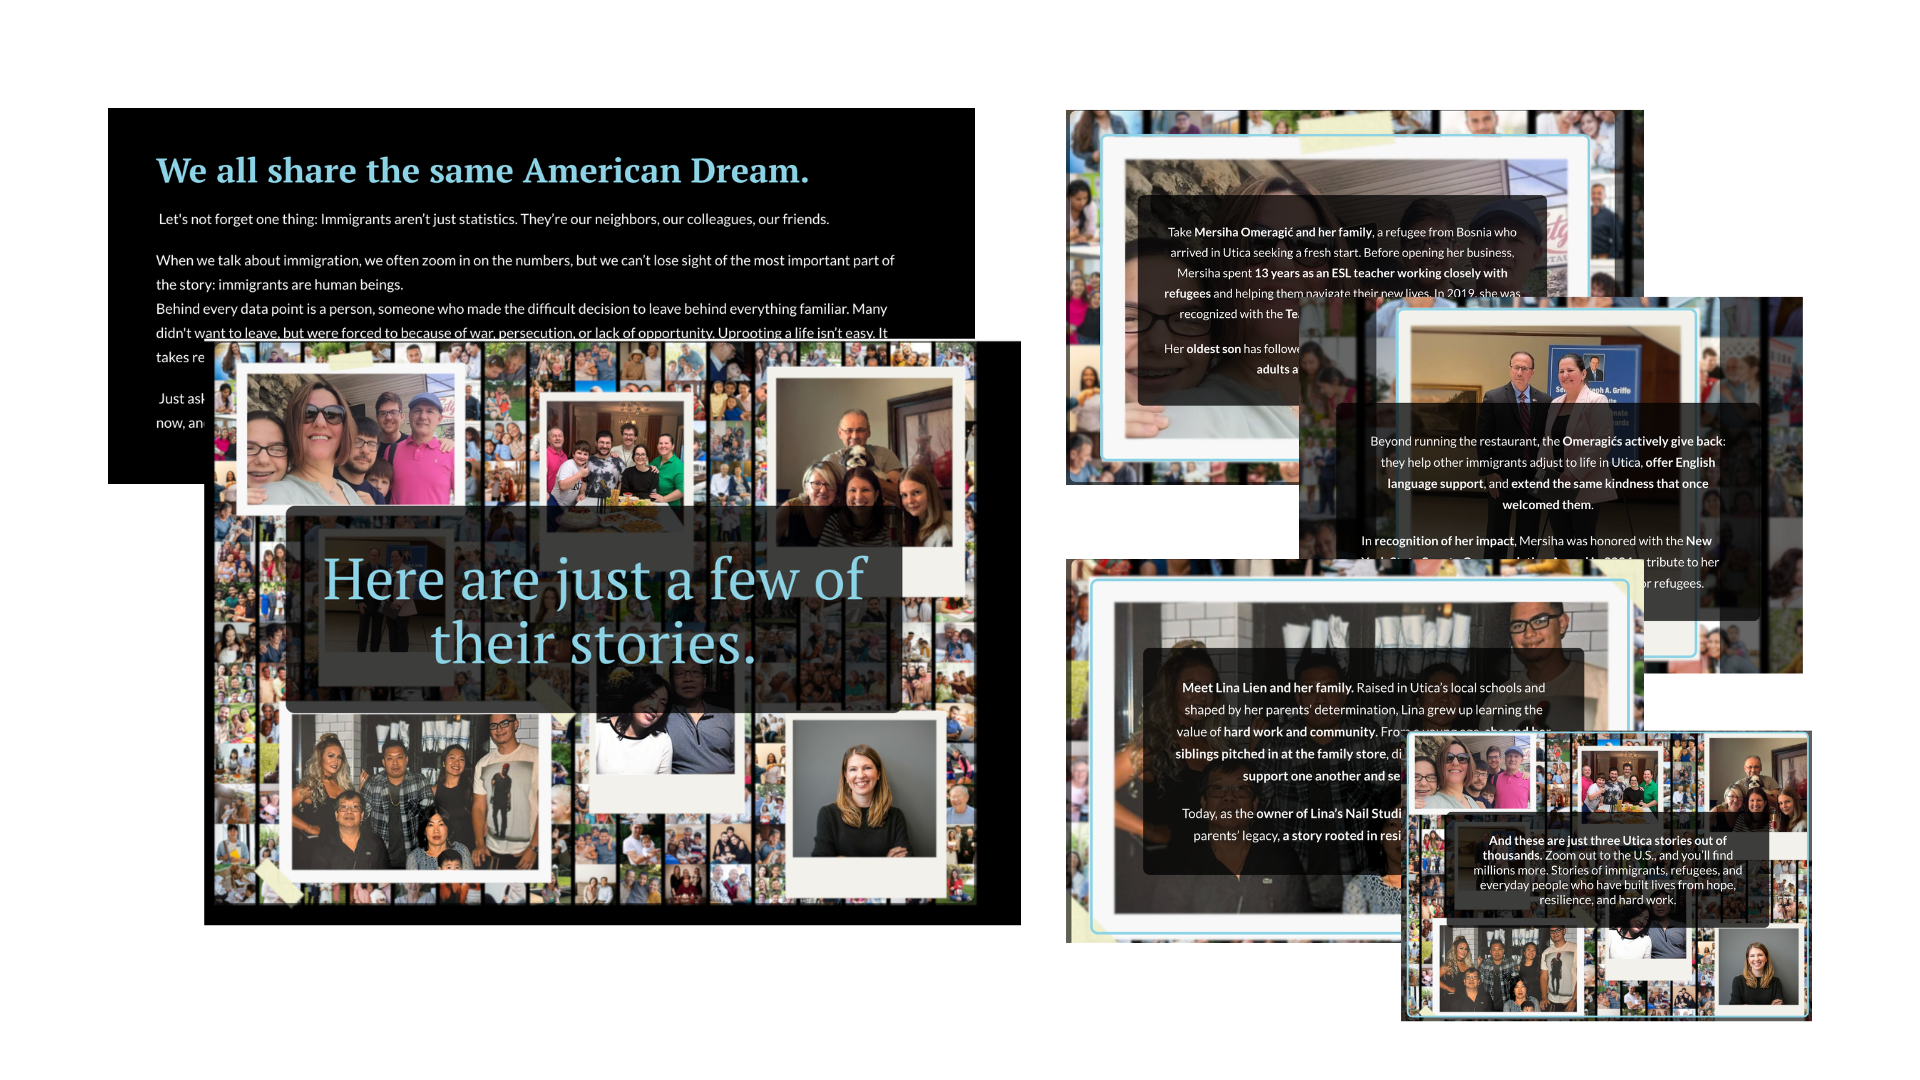
Making It Personal
The story closes on real families and real photographs, turning "immigrants" back into people with names and histories.